P.O Box1 , Uganda | Tel: 0392766616 | E-mail: www.kiboga.go.ug

Operation Wealth Creation
Introduction
Operation Wealth creation (OWC) program was initiated the in FY 2013/2014 to date countrywide. Since its inauguration, Kiboga District Local Government has received enormous support in terms of improved technologies (planting materials, equipment, animal breeds, feeds and equipment) to improve household incomes and food security. As a result of the above initiatives, Kiboga district is generally food secure due to improved extension services delivery, provision of improved planting materials / animal breeds, improved post harvest handling, and value addition.
This report captures all inputs and their costs, supplied and distributed to selected farmers in the district for the financial years 2016/2017 to date (Table 1). It also highlights key achievements, successful farmers, challenges encountered and recommendations for future interventions.
It also captures the achievements of Kisoboka approach in extension services delivery an initiative and supported Hon Ruth Nankabirwa Ssentamu in collaboration with the Production department.
Using the Kisoboka approach, Community based facilitators (CBFs) are equipped with knowledge and skills to train fellow farmers in basic farming practices. Some Community based facilitators are empowered and facilitated with transport means (bicycles), tape measures, hand hoes, spades, wheelbarrows to train fellow farmers (a farmer to farmer extension approach). Under Kisoboka approach, 16 farmers were give pregnant Sows on a revolving approach. A total 14000 banana suckers (10,000 tissue culture plantlets & 4,000 suckers) were distributed to selected and well prepared farmers in 2019.
A total of 44 Community based facilitators received bicycles of 24 were procured by Kiboga district LG and the 20 were procured by Hon. Ruth Nankabirwa. However, 24 CBFs were not given garden tools in the Sub counties of Kapeke, Dwaniro, Lwamata & Bukomero.
Table 1: OWC/ NAADS inputs for FYs 2015/16 to date (15/03/2021).
|
Financial year inputs & their costs |
||||||||||||||
|
|
2015/16 |
2016/17 |
2017/18 |
2018/19 |
2019/20 |
2020/21 |
||||||||
|
Type of input (s) |
Unit of measure |
Quantity |
Cost (U shs) |
Quantity |
Cost (U shs) |
Quantity |
Cost (U shs) |
Quantity |
Cost (U shs) |
Quantity |
Cost (U shs) |
|
Quantity |
Cost (U shs) |
|
Coffee Seedlings |
Number |
605,000 |
181,500,000 |
300,000 |
90,000,000 |
600,000 |
210,000,000 |
800,000 |
280,000,000 |
0 |
0 |
|
0 |
0 |
|
Banana Plantlets |
Number |
20452 |
38,006,404 |
19,658 |
44,230,500 |
0 |
0 |
15,000 |
47,700,000 |
11,000 |
36,300,000 |
|
0 |
0 |
|
Bean Seeds (Kgs) |
Kgs |
12,850 |
46,260,000 |
9,870 |
35,532,000 |
10,800 |
40,068,000 |
8,800 |
31,240,000 |
0 |
0 |
|
4,000 |
24,000,000 |
|
Cassava cuttings |
Bags |
0 |
0 |
0 |
0 |
473 |
23,650,000 |
569 |
28,450,000 |
0 |
0 |
|
0 |
0 |
|
Irish Potatoes |
Bags |
402 |
76,380,000 |
110 |
20,900,000 |
127 |
24,130,000 |
0 |
0 |
0 |
0 |
|
0 |
0 |
|
Maize Seeds |
Kg |
41,330 |
185,980,000 |
54,710 |
254,229,000 |
10,000 |
45,000,000 |
15,400 |
69,300,000 |
11,880 |
57,665,520 |
|
12,405 |
56,492,370 |
|
Dairy Heifers |
Number |
35 |
77,000,000 |
22 |
50,600,000 |
36 |
85,212,000 |
18 |
42,480,000 |
0 |
0 |
|
10 |
27,500,000 |
|
Boran bulls |
Number |
6 |
14,100,00 |
0 |
0 |
16 |
32,480,000 |
0 |
0 |
0 |
0 |
|
0 |
0 |
|
Goats |
Number |
0 |
0 |
100 |
30,000,000 |
0 |
0 |
0 |
0 |
0 |
0 |
|
0 |
0 |
|
Vaccines (FMD) |
Doses |
0 |
0 |
0 |
0 |
0 |
0 |
0 |
0 |
15,000 |
0 |
|
10,000 |
0 |
|
Vaccines (Rabies) |
|
|
|
|
|
|
|
|
|
|
|
|
|
|
|
Pigs |
Number |
0 |
0 |
0 |
0 |
54 |
16,200,000 |
0 |
0 |
0 |
0 |
|
0 |
0 |
|
Feeds (layer chick mash) |
Kg |
0 |
0 |
0 |
0 |
20,160 |
46368000 |
9,600 |
22,080,000 |
0 |
0 |
|
0 |
0 |
|
Day old Layer Chicks |
Number |
0 |
0 |
0 |
0 |
4,200 |
12,474,000 |
4,000 |
16,000,000 |
0 |
0 |
|
0 |
0 |
|
Growers mash |
Kg |
0 |
0 |
0 |
0 |
0 |
0 |
8,000 |
29,386,560 |
0 |
0 |
|
0 |
0 |
|
Chicken feeds |
Bags |
0 |
0 |
0 |
0 |
120 |
5,529,480 |
0 |
0 |
0 |
0 |
|
0 |
0 |
|
Fish fries ( Tilapia &cat fish) |
Number |
34,983 |
9,799,350 |
12,245 |
9,000,000 |
22,112 |
16,233,600 |
0 |
0 |
0 |
0 |
|
0 |
0 |
|
Starter feeds for Fish Fries |
Kgs |
4,754 |
17,100,138 |
0 |
0 |
1,420 |
5,529,480 |
0 |
0 |
0 |
0 |
|
0 |
0 |
|
Ginger sets |
Bags |
0 |
0 |
100 |
70,000,000 |
73 |
42,340,000 |
30 |
16,800,000 |
0 |
0 |
|
0 |
0 |
|
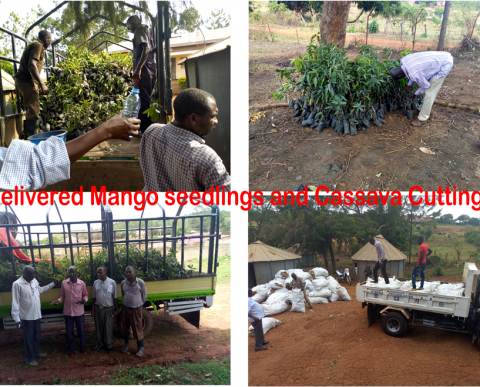
Grafted Mango Seedlings |
Number |
99,018 |
212,686,000 |
95,762 |
335,166,000 |
111,185 |
455,856,100 |
30,000 |
81,000,000 |
0 |
0 |
|
0 |
0 |
|
Budded Orange Seedlings |
Number |
300,000 |
127,500,000 |
20,000 |
56,000,000 |
6,286 |
22,000,000 |
0 |
0 |
0 |
0 |
0 |
0 |
|
|
Passion Fruit Seedlings |
Number |
0 |
0 |
20,000 |
14,000,000 |
0 |
75,250,000 |
0 |
0 |
0 |
0 |
0 |
0 |
|
|
Pesticides (Thiothiamate, triker & Cyermethrin) from MAAIF |
litres |
0 |
0 |
300 |
6,250,000 |
0 |
0 |
0 |
0 |
0 |
0 |
100 |
0 |
|
|
Inorganic fertilizers (N:P:K) |
Bags@50kgs |
0 |
0 |
0 |
0 |
0 |
0 |
0 |
0 |
192 |
23,880,000 |
0 |
0 |
|
|
Protective gears (overall & gum boots) |
Number |
0 |
0 |
0 |
0 |
0 |
0 |
0 |
0 |
0 |
0 |
5 |
0 |
|
|
Tractors |
|
|
|
|
|
|
|
|
|
2 |
0 |
0 |
0 |
|
|
Milk coolers |
Number |
|
|
|
|
|
|
|
|
|
|
|
|
|
|
Total (UShs) |
|
|
972,211,892 |
|
1,015,907,500 |
|
1,158,320,660 |
|
664,436,560 |
|
93,965,520 |
|
|
|
 Achievements/ success stories
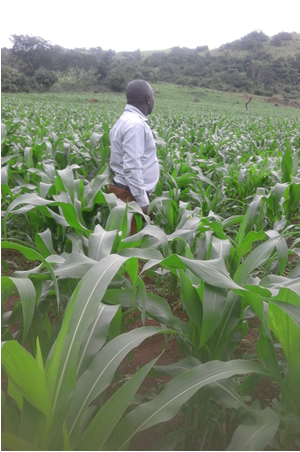
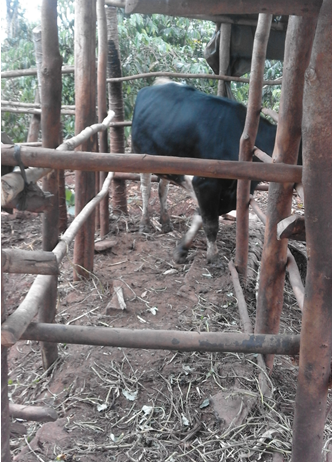

Maize, Bull for Breed improvement, & Coffee enterprises
Key achievements / successful famers
Ø Various farmers have been supported through extension services delivery, tractor hire services and provision of inputs (improved animal breeds, planting materials) in abide to promote household income and food security.
Table 2: A summary of inputs supplied and number of farmers supported for FYs 2018/19, 2019/20 and 2020/21 under OWC / NAADS program
|
Type of input(s) |
Quantity supplied |
Number of beneficiary farmers supported |
Financial year |
Acreages established |
Status (physical performance) |
||
|
Males |
Females |
Total |
|||||
|
Dairy heifers |
10 |
0 |
10 |
10 |
September 2020/2021 |
N/A |
90 % survival rate |
|
18 |
9 |
9 |
19 |
March –June 2018/2019 |
N/A |
80% survival rate |
|
|
Maize seeds (Kgs) |
12,405 |
849 |
469 |
1,318 |
Aug- Sept 2020 |
1240.5 |
Harvested |
|
Bean seeds (Kg) |
4,000 |
287 |
194 |
481 |
Aug- Sept 2020 |
133.3 |
Harvested |
|
Vegetable seeds (Amaranthus, Sukuma wiiki & Egg plants |
3kg of @ variety |
31 |
18 |
49 |
Aug- Sept 2020 |
0.5 |
Harvested |
|
Tractors (TAFE) |
02 |
|
|
|
March 2019/20 |
- |
100% functional |
|
Inorganic fertilizers (N:P:K) – Bags @ 50Kg |
192 |
118 |
28 |
146 |
June 2019/2020 |
N/A |
Applied |
|
Banana tissue culture plantlets |
15000 |
228 |
80 |
308 |
March- June 2018/19 |
33.7 |
Good |
|
Day old layer chicks |
4000 |
14 |
07 |
21 |
March – June 2018/19 |
N/A |
- |
|
Chick & duck mash ( Kg) |
9600 |
14 |
07 |
21 |
|||
|
Exotic Ginger sets ( bags) |
18 |
13 |
04 |
17 |
March – June 2018/19 |
2.3 |
Harvested |
|
Grafted mango seedlings |
23,950 |
469 |
144 |
613 |
March – June 2018/19 |
28.8 |
80% survival rate |
Ø Mechanized farming (tractor hire services). Kiboga district received two tractors (TAFE 60 HPs and TAFE 40 HPs each with a disc plough and disc hallow) to two farmer cooperatives of Dwaniro dairy cooperative and Lwamata grain producers’ cooperative. These tractors are used at subsided rates in opening up seedbeds (primary tillage and secondary tillage operations) to reduce drudgery and ensure timely farm operations.
|
S/N |
Tractor and cooperative name |
Rate per acre ploughed |
Period |
Acres ploughed |
|
1 |
Dwaniro Dairy and livestock farmers’ cooperative society Ltd. UBF 258M |
80,000= to 100,000= |
December 2020- March 2021 |
21 |
|
2 |
Lwamata grain producers’ cooperative. UBF 380P |
80,000- to 100,000= |
December 2020- March 2021 |
86 |
|
3 |
Massey Ferguson: UAT 295H attached to production department- Kiboga |
80,000= to 100,000= |
December 2020- March 2021 |
47 |
Food security status:
Kiboga district is generally food secure even during Covid - 19 lock down. This is mainly attributed to the conducive weather conditions (adequate rainfall since March 2020 to date, free abundant family labour force due to closer of schools as a result of Covid- 19 pandemic. Enhanced extension services by both Government and private workers.
Table II. A list of some of the successful beneficiary farmers supported under OWC, extension services delivery and Kisoboka approach in Kiboga District.
|
S/N |
LLG |
Farmer’s name |
Enterprise (s) |
Source / Program |
|
1 |
Kapeke S/C |
Christine Kasumba |
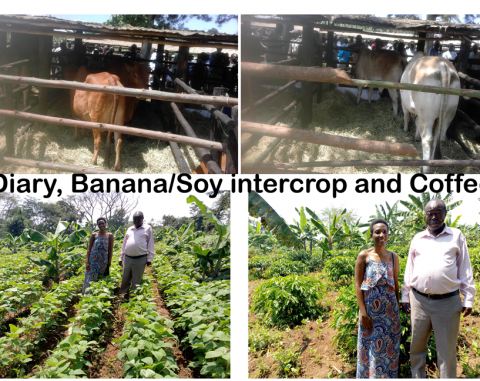
Banana- Coffee intercrop |
OWC/NAADS |
|
Ssentamu Brian |
Diary, banana, coffee |
OWC/ UCDA |
||
|
Nyamiringa Dairy cooperative |
Milk collection/ bulking & chilling- Milk cooler |
NAADS/ OWC |
||
|
Ms.Sarah Kamyuuka |
Bee keeping |
Production department- Advisory services |
||
|
Mutungi |
Diary, Pineapple |
Production department- Advisory services |
||
|
2 |
Kiboga T/C |
Hon. Dr. Ruth Nankabirwa Ssentamu |
Piggery, goats, Poultry, dairy, banana |
OWC/NAADS |
|
Mawejje |
Piggery |
|
||
|
Ssande Byakika |
Piggery, Tomato |
Kisoboka |
||
|
Sseguya Moses |
Banana, piggery |
Kisoboka |
||
|
Kitaka Mayanja |
Banana, Piggery |
Kisoboka |
||
|
Mawazi |
Mangoes |
OWC/NAADS |
||
|
Dr. Tingiira John Bosco |
Banana |
OWC/NAADS |
||
|
3 |
Lwamata T/C |
Margret Kato Nassande |
Bananas, cassava, mangoes, coffee, maize crib, kitchen gardening/ feed tower, goats |
OWC/NAADS, MAAIF / production |
|
Kansiime Jane |
Mangoes |
OWC/NAADS |
||
|
Kiwanuka John |
Dairy, coffee |
OWC/NAADS |
||
|
Kayana Lambert |
Mangoes, coffee |
OWC/NAADS |
||
|
4 |
Bukomero T/c |
Col. Mularo George William |
Piggery, Poultry, mangoes, water for production, maize mill |
OWC/NAADS |
|
Bugembe Ismael |
Poultry – Advisory |
Own / private |
||
|
5 |
Kibiga S/C |
Ssebagala William |
Piggery |
- |
|
Ndaula Costantine |
Coffee, vegetables |
OWC/NAADS, Kisoboka |
||
|
Haj. Kimera Avuga |
Mangoes |
OWC/NAADS |
||
|
Kabugo Charles |
Mangoes |
OWC/NAADS |
||
|
Katamba Zubairi (veteran) |
Coffee |
OWC/NAADS |
||
|
6 |
Muwanga S/C |
Kanakulya Sam |
Coffee, banana |
OWC/NAADS |
|
Ssebowa |
Coffee |
OWC/NAADS |
||
|
7 |
Bumoero S/C |
Gen. Muweesi |
Coffee & fertilizers |
OWC/NAADS |
Table III. Farmer Cooperatives formed as a result of Kisoboka and OWC/NAADS interventions in the district
|
S/N |
Enterprise (s) |
Name of cooperative (s) |
Membership |
|
1 |
Muwanga coffee |
Muwanga coffee farmers’ cooperative |
120 |
|
Bukomero coffee farmers’ cooperative |
80 |
||
|
2 |
Apiary / Bee keeping |
Kiboga bee keepers cooperative |
93 |
|
3 |
Maize and beans (grain) |
Lwamata grain producers cooperative |
340 |
|
4 |
Milk collection, bulking & selling |
Dwaniro dairy producers cooperative |
450 |
|
Nyamiringa dairy cooperative society |
250 |
||
|
5 |
Piggery |
Kiboga piggery producers cooperative society |
68 |

Key challenges encountered
|
Ø Inadequate funding (the department only receives PMG and extension grant funds) coupled with budget cuts have crippled implementation of planned sector activities and development projects Ø Unpredictable weather changes due to climate change affecting timely farm operations especially seedbed preparation, planting, harvesting and post-harvest handling Ø Unfunded priorities (especially water for production and establishment of micro irrigation sites to promoted dry season farming). Ø Inadequate funding and budget cuts hindering implementation of planned activities Ø Inadequate transport means and fuel allocation to extension workers amidst the high extension to farmer ratio of about 1: over 4500 compared to the recommended 1: 500. This renders the extension workers not visible on the ground. |
|
|||||
|
Ø Increasing incidences of pests/ parasites and diseases outbreaks in both crops (Black coffee twig borer) and livestock especially FMD, Lumpy Skin Disease, New castle Disease, swine fever. |
||||||
|
Ø Low adoption of technologies and limited value addition to agricultural commodities |
||||||
|
Ø High expectations from beneficiary farmers and yet OWC inputs/supplies are limited Ø Declining soil fertility due to continuous cultivation and nutrient mining Ø Counterfeit / fake agro-inputs on the market |
||||||
|
|
|
|||||
|
RECOMMENDATIONS |
||||||
|
Ø Lobby for funding projects such as ACDP, Ugfit, pasture resilience to support production sector planned activities. Ø Provision of water for production, timely weather forecasting and promotion of climate Smart agriculture technologies Ø Increase funding to MAAIF and Production departments in District Local Governments to facilitate extension services delivery. |
||||||
|
Ø Provision of more affordable technologies/ inputs and credits to farmers |
||||||
|
Ø Strengthen farmer trainings, demonstrations and value additions Ø Registration, regulation and training of agro input dealers in safe use and handling of agro-inputs. |
||||||
|
Ø Increase surveillance, prevention and control of diseases, pests and vectors Ø Strengthen Research Extension farmer linkages |
||||||
|
,, |
||||||